Ceph监控与告警体系:Prometheus+Grafana完整实践
Ceph监控与告警体系:Prometheus+Grafana完整实践
前言
完善的监控体系是保障Ceph集群稳定运行的基础。本教程将详细介绍如何构建Ceph监控体系,包括Prometheus指标采集、Grafana可视化配置、告警规则设计以及性能分析实践,帮助你建立全方位的Ceph运维监控能力。
1. Prometheus集成
1.1 启用Prometheus模块
# 启用Prometheus模块
ceph mgr module enable prometheus

# 配置Prometheus端口
ceph config set mgr mgr/prometheus/server_addr 0.0.0.0
ceph config set mgr mgr/prometheus/server_port 9283

# 查看Prometheus端点
curl http://ceph-mgr:9283/metrics
1.2 Prometheus配置
# prometheus.yml
scrape_configs:
  - job_name: 'ceph'
    static_configs:
      - targets: ['ceph-mgr:9283']
    relabel_configs:
      - source_labels: [__address__]
        target_label: instance
2. 核心指标解析
2.1 集群健康指标
# 健康状态
ceph_health_status

# OSD数量
ceph_osd_up
ceph_osd_in
ceph_osd_out

# PG状态
ceph_pg_total
ceph_pg_active
ceph_pg_clean
ceph_pg_undersized
ceph_pg_remapped
2.2 性能指标
# IOPS
ceph_osd_op_per_sec

# 吞吐量
ceph_osd_op_out_bytes
ceph_osd_op_in_bytes

# 延迟
ceph_osd_apply_latency_ms
ceph_osd_commit_latency_ms

# 恢复
ceph_osd_recovery_bytes
ceph_osd_recovery_ops
2.3 存储指标
# 容量
ceph_pool_capacity_bytes
ceph_pool_used_bytes

# 对象数
ceph_pool_objects

# 压缩
ceph_pool_compress_orn_bytes
ceph_pool_compress_latency_seconds
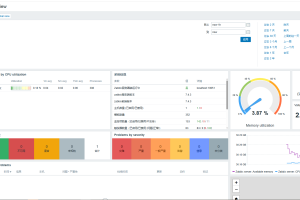
3. Grafana仪表板
3.1 安装与配置
# 安装Grafana
wget https://dl.grafana.com/oss/release/grafana_10.0.0_amd64.deb
dpkg -i grafana_10.0.0_amd64.deb
systemctl enable grafana-server
systemctl start grafana-server

# 添加数据源
# HTTP URL: http://ceph-mgr:9283
# Access: Browser
3.2 关键仪表板
{
  "dashboard": {
    "title": "Ceph Cluster Overview",
    "panels": [
      {
        "title": "Cluster Health",
        "type": "stat",
        "targets": [{
          "expr": "ceph_health_status"
        }]
      },
      {
        "title": "IOPS",
        "type": "graph",
        "targets": [{
          "expr": "rate(ceph_osd_op_per_sec[5m])"
        }]
      },
      {
        "title": "OSD Latency",
        "type": "graph",
        "targets": [{
          "expr": "ceph_osd_apply_latency_ms"
        }]
      }
    ]
  }
}
4. 告警规则
4.1 告警规则配置
# alerting.yml
groups:
- name: ceph-alerts
  rules:
  - alert: ClusterHealth
    expr: ceph_health_status != 0
    for: 1m
    labels:
      severity: critical
    annotations:
      summary: "Ceph cluster is unhealthy"

  - alert: OSDDown
    expr: ceph_osd_up == 0
    for: 5m
    labels:
      severity: warning
    annotations:
      summary: "OSD {{ $labels.osd }} is down"

  - alert: PGBackfill
    expr: ceph_pg_undersized > 0
    for: 10m
    labels:
      severity: warning
    annotations:
      summary: "PGs are undersized"

  - alert: StorageFull
    expr: ceph_pool_used_bytes / ceph_pool_capacity_bytes > 0.85
    labels:
      severity: warning
    annotations:
      summary: "Pool {{ $labels.pool }} is filling up"
4.2 AlertManager配置
# alertmanager.yml
route:
  group_by: ['alertname']
  receiver: 'default'
  routes:
  - match:
      severity: critical
    receiver: 'critical-alerts'

receivers:
- name: 'default'
  email_configs:
  - to: 'admin@example.com'
    send_resolved: true

- name: 'critical-alerts'
  pagerduty_configs:
  - service_key: 'YOUR_KEY'
5. 日志监控
5.1 日志级别配置
# 调整日志级别
ceph config set global debug_mon 10/10
ceph config set global debug_osd 10/10
ceph config set global debug_mgr 10/10

# 查看日志
journalctl -u ceph-mon@ceph-node01 -f
5.2 日志聚合
# 使用 Loki 收集日志
loki:
  config:
    server:
      http_listen_port: 3100
    common:
      storage:
        filesystem:
          directory: /tmp/loki
6. 性能分析实践
6.1 IO路径分析
# 查看客户端IO分布
ceph osd perf | sort -t' ' -k4 -rn | head -10

# 查看特定PG状态
ceph pg 1.3f query

# 分析慢查询
ceph osd pool stats | grep slow
6.2 容量预测
# 容量增长预测
# 使用历史数据预测未来容量
# 基于当前使用量和增长率计算剩余时间
7. 最佳实践
7.1 监控要点
1. 核心指标:健康状态、OSD状态、PG状态 2. 性能指标:IOPS、吞吐量、延迟 3. 容量指标:使用率、增长趋势 4. 恢复指标:恢复速度、恢复时间
7.2 告警优化
- 避免告警风暴
- 设置合理阈值
- 启用告警静默
- 定期审查告警规则
总结
完善的监控体系包括指标采集、可视化展示、告警通知三个核心环节。通过Prometheus+Grafana构建的监控体系,能够实时掌握Ceph集群运行状态,及时发现和处理故障,保障集群稳定运行。
声明:本站所有文章,如无特殊说明或标注,均为本站原创发布。任何个人或组织,在未征得本站同意时,禁止复制、盗用、采集、发布本站内容到任何网站、书籍等各类媒体平台。如若本站内容侵犯了原著者的合法权益,可联系我们进行处理。