Prometheus监控系统完整指南:从入门到精通
Prometheus监控系统完整指南
一、Prometheus简介
1.1 什么是Prometheus?
Prometheus是一个开源的监控和报警系统,由SoundCloud开发,现已成为Cloud Native Computing Foundation(CNCF)的毕业项目。
核心特点:
- 多维度数据模型
- 强大的查询语言PromQL
- 不依赖分布式存储
- 支持Pull和Push两种模式
- 易于部署和使用
1.2 架构原理
┌──────────────────────────────────────────────────────┐
│                   Prometheus Server                    │
│  ┌──────────────┐  ┌──────────────┐  ┌─────────┐ │
│  │   TSDB       │  │   Retriever │  │ HTTP Server│ │
│  │ (时序数据库)  │  │  (数据采集)  │  │  (API)   │ │
│  └──────────────┘  └──────────────┘  └─────────┘ │
└──────────────────────────────────────────────────────┘
           │                    │
           ▼                    ▼
    ┌────────────┐      ┌────────────┐
    │  Grafana    │      │ Alertmanager│
    │  (可视化)   │      │  (告警管理) │
    └────────────┘      └────────────┘
二、安装与配置
2.1 二进制安装
# 下载Prometheus
wget https://github.com/prometheus/prometheus/releases/download/v2.47.0/prometheus-2.47.0.linux-amd64.tar.gz

# 解压
tar xvf prometheus-2.47.0.linux-amd64.tar.gz

# 创建目录
sudo mkdir -p /etc/prometheus /var/lib/prometheus

# 复制二进制文件
sudo cp prometheus-2.47.0.linux-amd64/prometheus /usr/local/bin/
sudo cp prometheus-2.47.0.linux-amd64/promtool /usr/local/bin/
2.2 配置文件
# /etc/prometheus/prometheus.yml

global:
  scrape_interval: 15s
  evaluation_interval: 15s

alerting:
  alertmanagers:
    - static_configs:
        - targets:
          - localhost:9093

rule_files:
  - /etc/prometheus/rules/*.yml

scrape_configs:
  - job_name: 'prometheus'
    static_configs:
      - targets: ['localhost:9090']

  - job_name: 'node'
    static_configs:
      - targets: ['localhost:9100']
2.3 Systemd服务
# /etc/systemd/system/prometheus.service

[Unit]
Description=Prometheus Monitoring System
After=network.target

[Service]
User=prometheus
Group=prometheus
Type=simple
ExecStart=/usr/local/bin/prometheus   --config.file=/etc/prometheus/prometheus.yml   --storage.tsdb.path=/var/lib/prometheus   --storage.tsdb.retention.time=15d   --web.enable-lifecycle

Restart=on-failure

[Install]
WantedBy=multi-user.target
三、核心概念
3.1 数据模型
指标类型:
- Counter(计数器):只增不减
- Gauge(仪表盘):可增可减
- Histogram(直方图):累积直方图
- Summary(摘要):分位数统计
# Counter示例
http_requests_total{method="GET", status="200"}

# Gauge示例
cpu_usage{core="0"}

# Histogram示例
http_request_duration_seconds_bucket{le="0.1"}
3.2 PromQL查询
# 查询所有HTTP请求
http_requests_total

# 查询特定标签
http_requests_total{method="GET"}

# 速率计算
rate(http_requests_total[5m])

# 使用函数
increase(http_requests_total[1h])
topk(10, http_requests_total)
四、监控配置
4.1 监控Linux主机
# /etc/prometheus/node_exporter.yml

scrape_configs:
  - job_name: 'node'
    static_configs:
      - targets: ['localhost:9100']
4.2 监控Docker
# 使用cAdvisor监控Docker

- job_name: 'cadvisor'
  static_configs:
    - targets:
      - localhost:8080
4.3 告警规则
# /etc/prometheus/rules/node_alerts.yml

groups:
  - name: node_alerts
    rules:
      - alert: HighCPUUsage
        expr: 100 - (avg by(instance) (rate(node_cpu_seconds_total{mode="idle"}[5m])) * 100 > 80
        for: 5m
        labels:
          severity: warning
        annotations:
          summary: "CPU使用率过高"
          description: "服务器 {{ $labels.instance }} CPU使用率超过80%"

      - alert: HighMemoryUsage
        expr: (node_memory_MemTotal_bytes - node_memory_MemAvailable_bytes) / node_memory_MemTotal_bytes * 100 > 85
        for: 5m
        labels:
          severity: warning
        annotations:
          summary: "内存使用率过高"

      - alert: DiskSpaceLow
        expr: (node_filesystem_avail_bytes{mountpoint="/"} / node_filesystem_size_bytes{mountpoint="/"}) * 100 < 15
        for: 10m
        labels:
          severity: critical
五、Alertmanager配置
# /etc/alertmanager/alertmanager.yml

global:
  resolve_timeout: 5m

route:
  group_by: ['alertname']
  receiver: 'default'
  routes:
    - match:
        severity: critical
      receiver: 'critical-alerts'

receivers:
  - name: 'default'
    email_configs:
      - smtp_smarthost: 'smtp.example.com:465'
        smtp_auth_username: 'alerts@example.com'
        smtp_auth_password: 'your-password'
        to: 'admin@example.com'

  - name: 'critical-alerts'
    webhook_configs:
      - url: 'http://localhost:8060/dingtalk/webhook1/send'
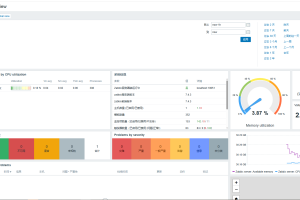
六、Grafana集成
# 安装Grafana
sudo apt-get install -y grafana

# 启动服务
sudo systemctl start grafana-server
sudo systemctl enable grafana-server

# 访问地址
# http://localhost:3000
# 默认用户名: admin
# 默认密码: admin
添加数据源:
七、性能优化
7.1 存储优化
# prometheus.yml

storage:
  tsdb:
    retention.time: 15d
    retention.size: 100GB
    head_chunk_bytes: 32768
7.2 采集优化
scrape_configs:
  - job_name: 'kubernetes-nodes'
    kubernetes_sd_configs:
      - role: node
    relabel_configs:
      - action: labelmap
        regex: __meta_kubernetes_node_label_(.+)
八、常见问题
8.1 启动失败
# 检查配置
promtool check config /etc/prometheus/prometheus.yml

# 查看日志
journalctl -u prometheus -n 100
8.2 性能问题
# 查看性能指标
curl http://localhost:9090/metrics | grep prometheus_http

# 分析查询
http://localhost:9090/graph
九、总结
本文介绍了Prometheus监控系统的完整配置。
核心要点:
相关阅读:
- Prometheus官方文档
- PromQL查询语言
- Alertmanager配置
声明:本站所有文章,如无特殊说明或标注,均为本站原创发布。任何个人或组织,在未征得本站同意时,禁止复制、盗用、采集、发布本站内容到任何网站、书籍等各类媒体平台。如若本站内容侵犯了原著者的合法权益,可联系我们进行处理。